← Visit Appcues.com
×
×

How to set metrics for product launches

How Amplitude sets product performance metrics, and why you should start doing it too.
Skip to section:

Skip to section:

How we set product performance metrics at Amplitude, and why you should start doing it too

One of my most favorite books related to product management is Lean Analytics. Most famously, it outlines the role of data in the build –> measure –> learn product development cycle, and what makes a good metric.

A less well known concept discussed in Lean Analytics is a process in product development that they call ‘drawing a line in the sand’. The idea is simple: before you release any new product or feature, set a measurable target that will determine whether or not the release was successful.

When I first read about all of this (I was graduating college at the time), it sounded simple enough. Yeah, sure – set a target, check if you hit it, makes sense. 

And yet, I’ve seen very few product teams actually do it. Empowered product teams might set quarterly business-wide OKRs and measure themselves against that, but I rarely see this practice applied down to the level of a feature release.

Don’t fall into the “Fun Fact” metrics trap

What happens instead is what I like to call Fun Facts. A Fun Fact is a contextless number generated after a release that makes people feel good at the cost of obfuscating actual success measurement. For example: “Over 4,000 people have used this feature already!” or “Awesome funnel conversion so far – 60%!”

These types of product analytics stats often get quoted in weekly standing product meetings, and everyone looks around and says “interesting!”

At best, Fun Facts are irrelevant. 

At worst, they spread as a meme within the company, get quoted by executives at company meetings and with external partners, and contribute to shaping misguided product strategy.

Why set metric targets for every product release

One of my favorite quotes in Horowitz’s Hard Thing about Hard Things is “All decisions were objective until the first line of code was written. After that, all decisions were emotional.”

It’s true – as soon as something moves from critiqueable design mocks to engineering requirements, it becomes a lot harder to admit failure. Nobody wants to tell the engineers and designers that nobody is using the thing they spent weeks working on. 

That’s exactly why, as a product manager, you should insist on setting your metrics, your key performance indicators (KPIs) before that first line of code is written.

At a high level, three things happen to a team that sets targets product metrics:

Setting product metrics builds team alignment

Making metrics a core part of the release process builds focus. It’s always easier to have a discussion about design, or development release timing decision, when everyone in the room agrees on why this thing is being released in the first place.

Agreeing on a target is an amazing way to resolve design disputes and keep moving forward. Disputes like this generally come from a misalignment on goals, so being specific and quantifying what success looks like gives folks the right context for making decisions about pet features or design minutia.

It builds autonomy

The practice of setting and communicating targets before a release builds trust and autonomy for your team. It’s the same idea as why you should set OKRs. It helps ensure that your team has the space to come up with the right solution to a problem, rather than the solution which most closely matches what executives think might solve the problem. It builds company-wide trust through accountability, and ensures that your team has space to breathe.

It introduces accountability

Setting metric targets introduces accountability into product development, reminding us all that we’re building for customers and that only the customer, not the designer, engineer, product manager, or executive, will determine whether it’s successful.

It also ensures that the product development team is thinking iteratively. Every time you commit to a metric, it should be an uncomfortable experience that makes you think: “Okay so what do we do if we don’t hit this?” This attitude empowers the designer to start thinking ahead to the V1.1 iteration, and for the engineer to build-in more code abstractions enabling the team to iterate faster.

An example of how we set product release targets at Amplitude

Last month, our team set out to add user profiles to Amplitude. The idea was to lay the foundation for building more social validation into the platform. We wanted to make building charts and dashboards in Amplitude feel more personally rewarding, and introduce additional search traversal routes for analysis consumers.

The design kicked off with a product one-pager (similar to Intercom’s Intermissions), where we set a high level context, development scoping, and non-priorities. After a few rounds of iteration with the team, the designer came back with these mockups:
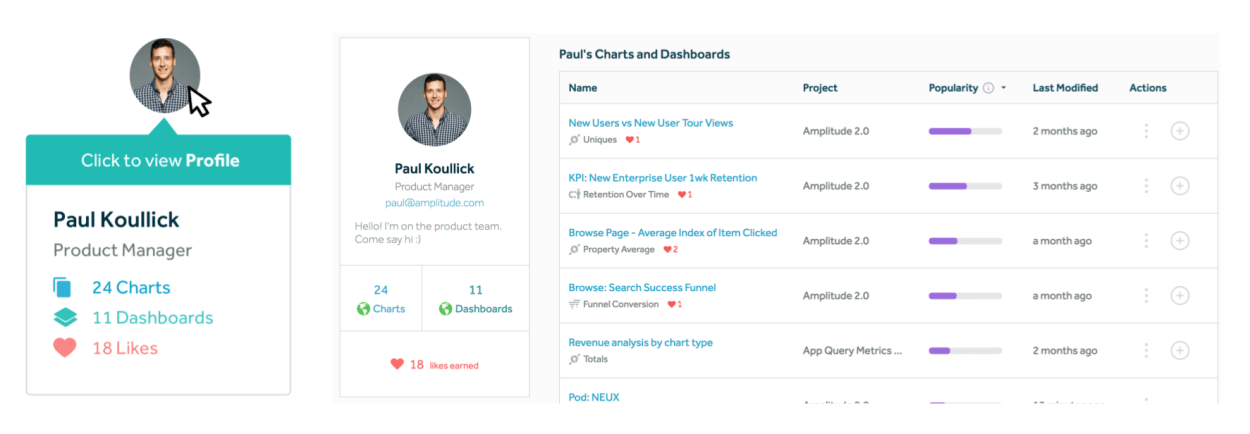
Mockup design of the Amplitude user profile.

Defining your product metrics

Defining good metrics is an art, but, logistically speaking, we created a simple spreadsheet with two sections. The first section is for primary metrics, which are designed to be overall success indicators. If we don’t hit these, we should go back to the drawing board with the release and re-examine our core product assumptions.

A sample of product metrics, broken down into primary and secondary metrics.

Our primary metrics for the user portfolio feature release were:

  • Engagement (self) – % of DAU that visit their own profile page
  • Engagement (others) – % of DAU that visit someone else’s profile
  • Hover engagement – % of DAU that enable a profile hover state
  • Discovery – % of new enterprise users who visit another user’s profile in 1st session

A secondary metric is meant to validate smaller design decisions made. Missing a secondary metric means we should make adjustments to the design, but doesn’t indicate overall release success or failure.

Our secondary metrics for the user portfolio feature release were:

  • Photo engagement – % of profile hovers that have a photo
  • Description engagement – % of users who have added a photo within a week of viewing their own profile
  • Navigation to browse – % of users who click on dashboards/charts/likes links when visiting a profile page
  • Popular content engagement – % of users who click on the popular dashboards/charts table when visiting a profile page

How to set realistic product KPIs

Using the above spreadsheet, we sat down as a product development team (design, engineering, pm) and set the success metrics together. As we went down the list, we would discuss the closest proxy metric, decide on a target to commit to, and briefly mention what we’d need to do if the target wasn’t hit.

For example, we set a target of 10% for the percent of daily active users would visit their own profile page. We proxied this metric by looking at an existing analogous feature usage where you could use our search feature to find your previously created content. Given that the new profile page was designed to be more valuable and more discoverable, we decided to set this target somewhat aggressively – about 50% higher than the proxy. If we don’t hit that, the designer suggested that we might think about changing the link color to blue, making the hover state more engaging, or we might have to go back to the drawing board entirely.

Another target we set was that 20% of the time when a profile hover state was enabled, the profile should have a photo. The design had a prominent avatar photo placement on the hover state, and this was a topic of heated discussion during the design iteration process. Setting a target together with engineering and design built alignment and removed the politics from the decision. Now, we knew that we’d need to make an adjustment to the designs if we couldn’t get enough users to upload photos to justify the prominence of user photos product-wide.

What to do post-product release

Having set the targets up-front, it was very easy for me to prepare a reporting dashboard upon release. Folks felt ownership over the numbers, and it was exciting to see the numbers come in against our targets.

Rather than reporting Fun Facts, the team felt proud and empowered by the data. It also made product reviews extremely easy to prepare since I already had the metric targets, and could trivially provide an is this good or bad perspective. In short, setting metric targets before development front-loaded a lot of the analysis work we’d have to do anyway.

[Editor's note: This article was originally published on Amplitude's blog.]

Paul Koullick
Product Manager at Amplitude
Skip to section:

Skip to section:

How we set product performance metrics at Amplitude, and why you should start doing it too

One of my most favorite books related to product management is Lean Analytics. Most famously, it outlines the role of data in the build –> measure –> learn product development cycle, and what makes a good metric.

A less well known concept discussed in Lean Analytics is a process in product development that they call ‘drawing a line in the sand’. The idea is simple: before you release any new product or feature, set a measurable target that will determine whether or not the release was successful.

When I first read about all of this (I was graduating college at the time), it sounded simple enough. Yeah, sure – set a target, check if you hit it, makes sense. 

And yet, I’ve seen very few product teams actually do it. Empowered product teams might set quarterly business-wide OKRs and measure themselves against that, but I rarely see this practice applied down to the level of a feature release.

Don’t fall into the “Fun Fact” metrics trap

What happens instead is what I like to call Fun Facts. A Fun Fact is a contextless number generated after a release that makes people feel good at the cost of obfuscating actual success measurement. For example: “Over 4,000 people have used this feature already!” or “Awesome funnel conversion so far – 60%!”

These types of product analytics stats often get quoted in weekly standing product meetings, and everyone looks around and says “interesting!”

At best, Fun Facts are irrelevant. 

At worst, they spread as a meme within the company, get quoted by executives at company meetings and with external partners, and contribute to shaping misguided product strategy.

Why set metric targets for every product release

One of my favorite quotes in Horowitz’s Hard Thing about Hard Things is “All decisions were objective until the first line of code was written. After that, all decisions were emotional.”

It’s true – as soon as something moves from critiqueable design mocks to engineering requirements, it becomes a lot harder to admit failure. Nobody wants to tell the engineers and designers that nobody is using the thing they spent weeks working on. 

That’s exactly why, as a product manager, you should insist on setting your metrics, your key performance indicators (KPIs) before that first line of code is written.

At a high level, three things happen to a team that sets targets product metrics:

Setting product metrics builds team alignment

Making metrics a core part of the release process builds focus. It’s always easier to have a discussion about design, or development release timing decision, when everyone in the room agrees on why this thing is being released in the first place.

Agreeing on a target is an amazing way to resolve design disputes and keep moving forward. Disputes like this generally come from a misalignment on goals, so being specific and quantifying what success looks like gives folks the right context for making decisions about pet features or design minutia.

It builds autonomy

The practice of setting and communicating targets before a release builds trust and autonomy for your team. It’s the same idea as why you should set OKRs. It helps ensure that your team has the space to come up with the right solution to a problem, rather than the solution which most closely matches what executives think might solve the problem. It builds company-wide trust through accountability, and ensures that your team has space to breathe.

It introduces accountability

Setting metric targets introduces accountability into product development, reminding us all that we’re building for customers and that only the customer, not the designer, engineer, product manager, or executive, will determine whether it’s successful.

It also ensures that the product development team is thinking iteratively. Every time you commit to a metric, it should be an uncomfortable experience that makes you think: “Okay so what do we do if we don’t hit this?” This attitude empowers the designer to start thinking ahead to the V1.1 iteration, and for the engineer to build-in more code abstractions enabling the team to iterate faster.

An example of how we set product release targets at Amplitude

Last month, our team set out to add user profiles to Amplitude. The idea was to lay the foundation for building more social validation into the platform. We wanted to make building charts and dashboards in Amplitude feel more personally rewarding, and introduce additional search traversal routes for analysis consumers.

The design kicked off with a product one-pager (similar to Intercom’s Intermissions), where we set a high level context, development scoping, and non-priorities. After a few rounds of iteration with the team, the designer came back with these mockups:

Mockup design of the Amplitude user profile.

Defining your product metrics

Defining good metrics is an art, but, logistically speaking, we created a simple spreadsheet with two sections. The first section is for primary metrics, which are designed to be overall success indicators. If we don’t hit these, we should go back to the drawing board with the release and re-examine our core product assumptions.

A sample of product metrics, broken down into primary and secondary metrics.

Our primary metrics for the user portfolio feature release were:

  • Engagement (self) – % of DAU that visit their own profile page
  • Engagement (others) – % of DAU that visit someone else’s profile
  • Hover engagement – % of DAU that enable a profile hover state
  • Discovery – % of new enterprise users who visit another user’s profile in 1st session

A secondary metric is meant to validate smaller design decisions made. Missing a secondary metric means we should make adjustments to the design, but doesn’t indicate overall release success or failure.

Our secondary metrics for the user portfolio feature release were:

  • Photo engagement – % of profile hovers that have a photo
  • Description engagement – % of users who have added a photo within a week of viewing their own profile
  • Navigation to browse – % of users who click on dashboards/charts/likes links when visiting a profile page
  • Popular content engagement – % of users who click on the popular dashboards/charts table when visiting a profile page

How to set realistic product KPIs

Using the above spreadsheet, we sat down as a product development team (design, engineering, pm) and set the success metrics together. As we went down the list, we would discuss the closest proxy metric, decide on a target to commit to, and briefly mention what we’d need to do if the target wasn’t hit.

For example, we set a target of 10% for the percent of daily active users would visit their own profile page. We proxied this metric by looking at an existing analogous feature usage where you could use our search feature to find your previously created content. Given that the new profile page was designed to be more valuable and more discoverable, we decided to set this target somewhat aggressively – about 50% higher than the proxy. If we don’t hit that, the designer suggested that we might think about changing the link color to blue, making the hover state more engaging, or we might have to go back to the drawing board entirely.

Another target we set was that 20% of the time when a profile hover state was enabled, the profile should have a photo. The design had a prominent avatar photo placement on the hover state, and this was a topic of heated discussion during the design iteration process. Setting a target together with engineering and design built alignment and removed the politics from the decision. Now, we knew that we’d need to make an adjustment to the designs if we couldn’t get enough users to upload photos to justify the prominence of user photos product-wide.

What to do post-product release

Having set the targets up-front, it was very easy for me to prepare a reporting dashboard upon release. Folks felt ownership over the numbers, and it was exciting to see the numbers come in against our targets.

Rather than reporting Fun Facts, the team felt proud and empowered by the data. It also made product reviews extremely easy to prepare since I already had the metric targets, and could trivially provide an is this good or bad perspective. In short, setting metric targets before development front-loaded a lot of the analysis work we’d have to do anyway.

[Editor's note: This article was originally published on Amplitude's blog.]

Paul Koullick
Product Manager at Amplitude
You might also like...