
You’ve created a Workflow in Appcues. Maybe it’s a simple reminder to finish setup. Maybe it’s a multi-step email and push sequence to bring back inactive users.
Now that it’s live, the next step is figuring out how it’s performing—and how to make it even better.
From open rates to click-throughs (and eventually conversion), this post walks through what to look for in your Workflow metrics, where your numbers stand compared to industry benchmarks, and how to use that data to create more impactful messages across email and push.
Workflows is a feature in Appcues that lets you send automated messages—via email and push notifications—based on how people interact with your product. The goal is to help users stay on track, even when they’re not actively using your product.
Some common use cases:
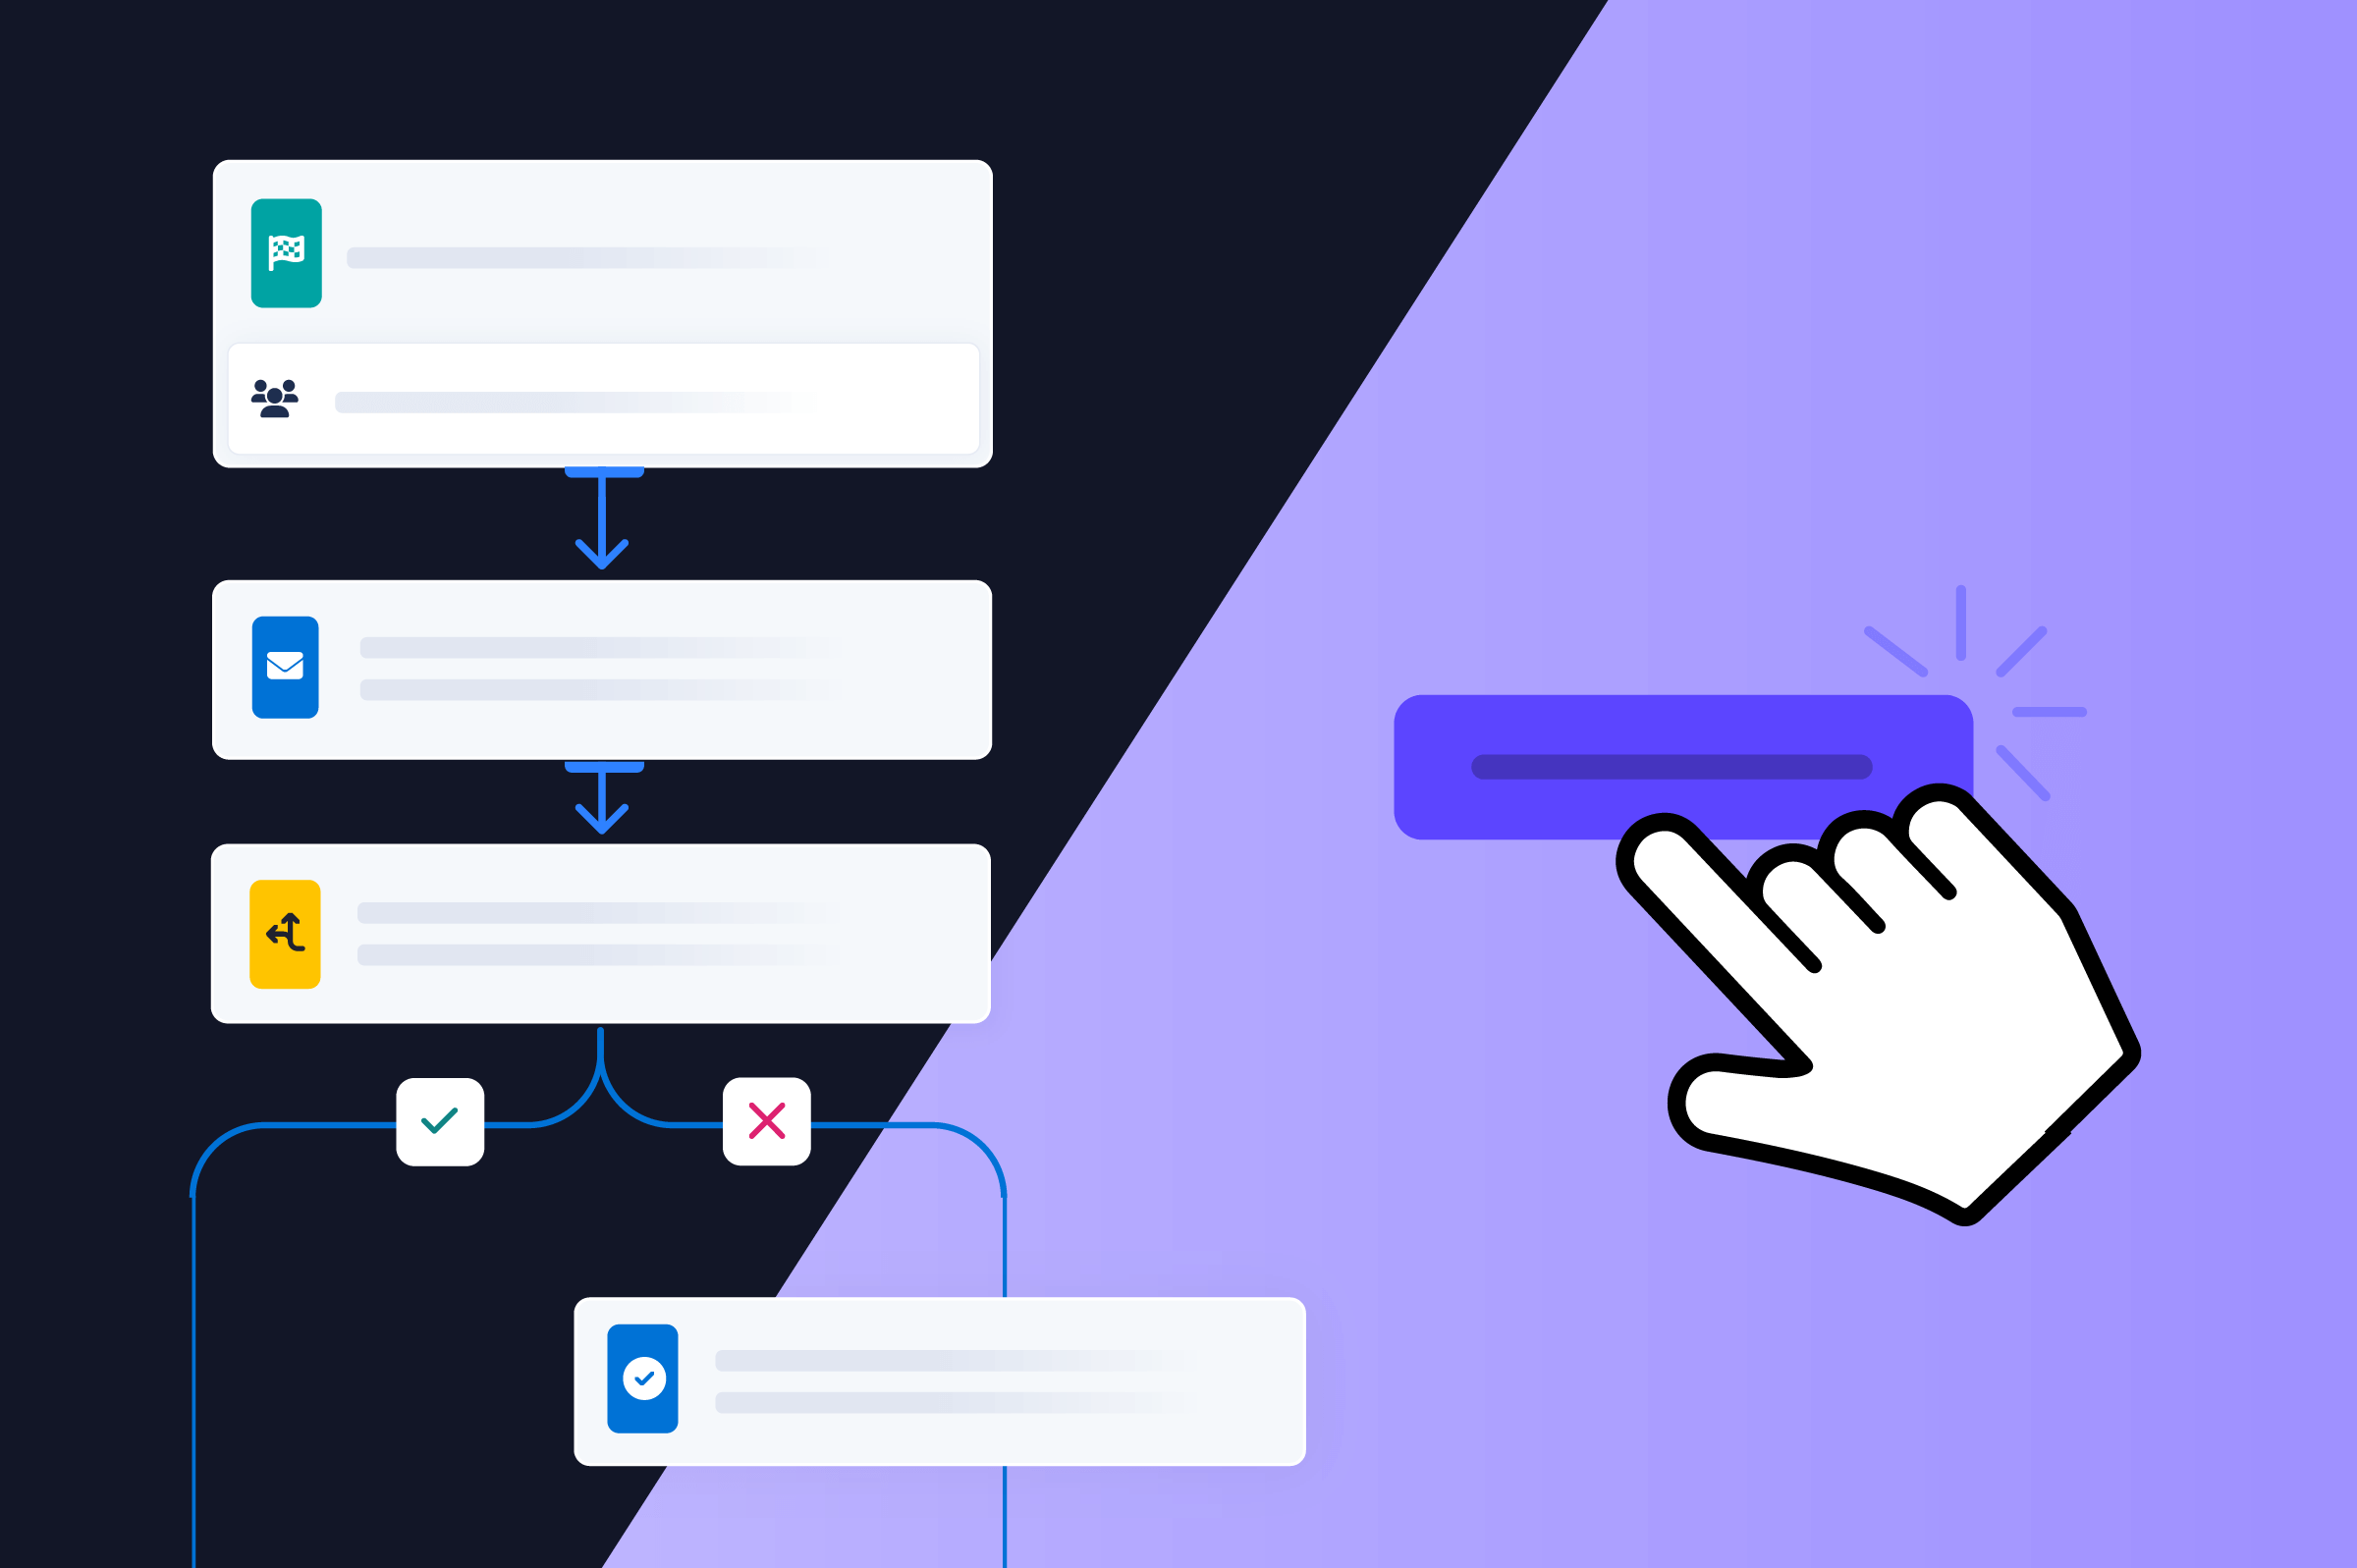
Each Workflow includes a trigger, a targeted audience, and a series of messages that guide users toward a meaningful action.

Let’s break it down by channel. Your Workflow might start with an email, follow up with a push, or use both—so it’s important to understand how each one typically performs.
Email continues to be one of the most effective ways to reach SaaS users—especially when messages are personalized, behavior-based, and sent at the right moment.
Here’s what most product-led teams aim for:
Sources: Campaign Monitor, Mailchimp
If your open rates are hovering around 35%, you’re in a good place. CTRs naturally tend to be lower—but if 3–5% of recipients are clicking, that’s a healthy signal that your message is getting the job done.
Just remember: performance varies by audience and intent. A setup reminder will almost always outperform a passive newsletter-style update. That’s expected—and it’s why context matters.

Push notifications are great for short, timely nudges—especially when a user is on mobile and not checking their inbox. They won’t get the same engagement numbers as email, but they still drive action when used well.
Typical benchmarks:
Even a 5% CTR on a push can lead to meaningful usage—especially if it’s driving users to complete a core task or revisit something they skipped.

In addition to engagement metrics, every Workflow in Appcues can be tied to a goal—usually a product action like finishing onboarding, trying a new feature, or returning to the product. Once your Workflow is live, you’ll be able to track how many users entered it and how many completed that goal.
While we don’t yet have Appcues-specific benchmarks, broader conversion data offers some helpful context. For example, Unbounce reports that SaaS landing page conversion rates typically fall between 2–6%. Your Workflow goals may be more behavior-driven, but this range gives a rough idea of what to expect when asking users to take meaningful action.

Once your Workflow is live, take a look at the full path—from delivery to engagement:
Each step tells you something different—and small changes can often lead to big improvements.
Here are a few low-lift ways to improve Workflow performance based on what your data’s telling you:
Rethink your subject line or push title. Clear and specific almost always beats clever. Lead with value.
Simplify the message. Remove friction. Make the CTA more prominent and obvious.
Try another channel. Push might work better for some users. For others, it’s email. That’s why Workflows support both.
And remember: Appcues Workflows are designed to be flexible. You can add delays, set exit conditions, and build logic based on what’s working—and what’s not.
You don’t need to be a messaging expert to evaluate Workflow performance. A solid open rate for email is 30–40%. A strong CTR is 3–6%. For push, expect slightly lower engagement—but no less impact when timed right.
What matters most is momentum. Did your message move someone forward? If so, it’s working. And if not? You’ve got the data to make informed changes and try again.
If you’re already using Appcues, hop into your account to check how your Workflow is performing—or build your first one and keep an eye on the results. And if you’re still exploring, book a demo to see how Workflows help turn product moments into user action.


.png)
.png)