
.png)

Mixpanel funnels show you exactly where users drop off during onboarding. This guide walks you through setup, optimization, and the metrics that matter.
The setup is straightforward. Install Mixpanel, create user profiles, configure event tracking, and build a funnel that maps your onboarding flow from signup to activation.
The real payoff is acting on what the funnel reveals. Pair your insights with targeted in-app experiences to guide users through drop-off points. User onboarding grounded in real data has a measurable impact on your bottom line.
Introduction
Most SaaS teams know onboarding matters. Fewer know exactly where their onboarding breaks down. Research consistently shows that 40-60% of users who sign up for a SaaS product will use it once and never come back. The difference between the products that retain users and the ones that don't usually comes down to one thing: whether the team can see the drop-off points and act on them fast enough.
That's where funnel analysis comes in. A well-built onboarding funnel in Mixpanel gives you a clear, step-by-step view of how new users move through your product - and where they stop moving.
This guide walks you through the full process: setting up Mixpanel, building an onboarding funnel, optimizing it with real data, and tracking the metrics that tell you whether things are getting better. We'll also share a real case study from our own onboarding at Appcues, where funnel analysis led to a simple change that meaningfully improved our completion rate.
Whether you're a product manager defining onboarding steps or a marketing leader measuring activation, you'll walk away with a repeatable process for turning funnel data into better user experiences.
A Mixpanel funnel tracks a sequence of events that users complete (or abandon) inside your product. Unlike page-based analytics, Mixpanel is one of many product analytics tools that uses an event-based data model. That means you define the specific actions that matter - like "signed up," "completed profile," and "created first project" - and the funnel shows you conversion rates between each step.
For onboarding, this is especially useful. You can map your ideal activation path and see exactly which step loses the most users. For example, when Slack was growing rapidly, their team identified that users who sent 2,000+ messages within a workspace were far more likely to convert to paid. A Mixpanel-style funnel tracking signup > team creation > first message > 2,000th message would surface exactly where that journey breaks down. If 80% of your signups complete their profile but only 30% create their first project, you know where to focus.
Mixpanel funnels also support segmentation, so you can break down conversion rates by cohort - acquisition source, plan type, device, or any user property you track. That level of detail turns a general "users are dropping off" observation into a specific, actionable insight. We'll cover cohort analysis in detail later in this guide.
The first thing you'll need to do is install Mixpanel. You'll likely need the help of a developer for this step. Developers should consult Mixpanel's JavaScript documentation for the most current installation instructions and SDK setup.
The general process involves adding the Mixpanel JavaScript library to your application. For new users, Mixpanel provides the snippet pre-populated with your project token on the welcome page.


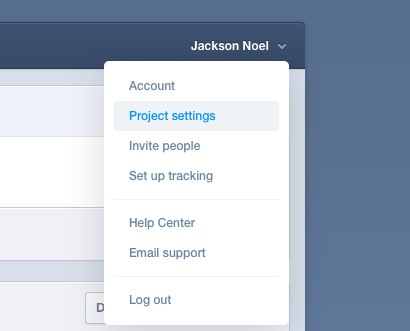
If you need to find your project token, click on your name in the upper right corner of your dashboard and select "Project settings" from the dropdown menu:

If you use Segment, a platform that collects and sends customer data through to other tools, you'll need to set up the integration through Segment.
Mixpanel assigns a default unique identifier to each unique user. Assigning your own user ID is optional but recommended if users access your product on multiple platforms. You can assign your own user IDs by using mixpanel.identify.
After assigning your own user IDs, you can also store user profiles, which contain properties about a specific user - information like email address, where they came from, and name. This is optional, but doing so will help you identify specifically who is completing each stage of the onboarding funnel.
Here is a sample user profile:
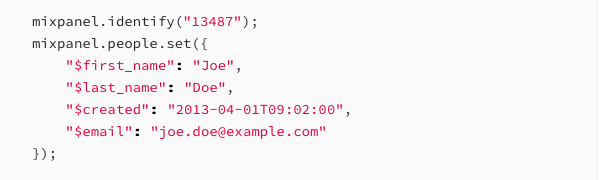
Add the tracking code to the page to create a new profile.
Mixpanel also lets you link anonymous user data to a user ID, which is helpful if users browse your product anonymously before signing up. The recommended approach is to call mixpanel.identify when a user signs up or logs in, which merges their anonymous activity with their identified profile.
More information on creating a profile: Mixpanel's profile documentation
More information on identity management: Mixpanel's identity management guide
Product managers should name the events they want to track and pass these names onto the developer.
The developer will then track each event using the following code in your application source code when or wherever the event happens:
mixpanel.track("EVENT_NAME_HERE");
You can also add properties to each event for more detail. Properties can describe the user, as mentioned above, or relate to a specific event. Mixpanel recommends keeping events general and built around meaningful actions. If "Signup" is an important event, a property could then be "Browser."
More information here: Mixpanel's event naming guide
Now that your developer has entered the events into Mixpanel, you can start to order them into the sequential steps that a new user would take.
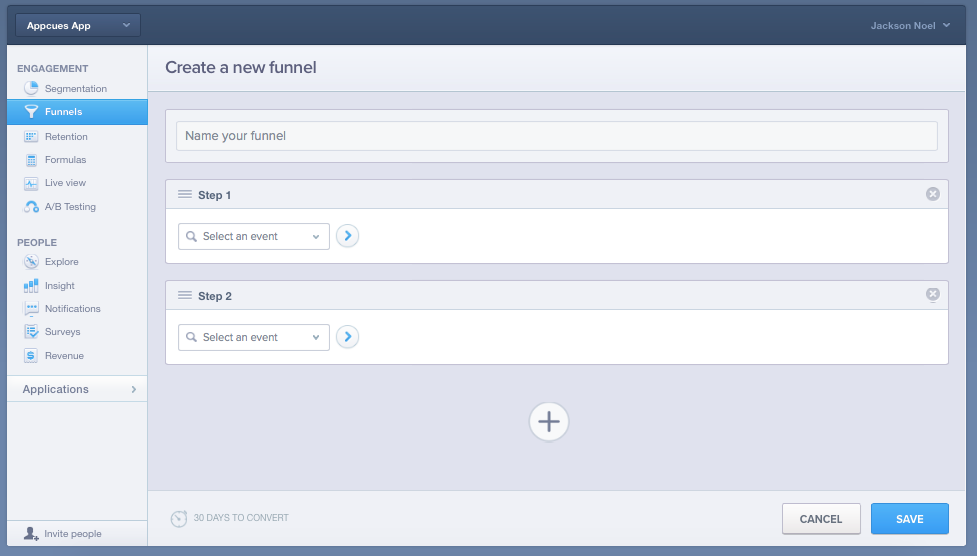
In your Funnels dashboard, click the plus sign to create a new funnel:

Then, fill out basic information:
Mixpanel will start collecting data immediately, but it can take a few days, or weeks if you have a smaller user base, before you can derive meaningful insights from your funnel.
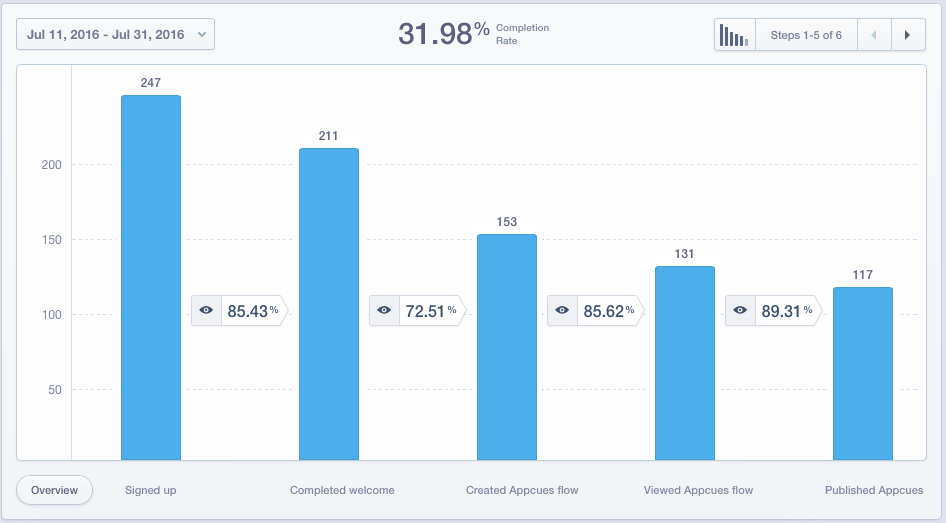
Once you have meaningful data flowing into your funnel, here's what you might see:
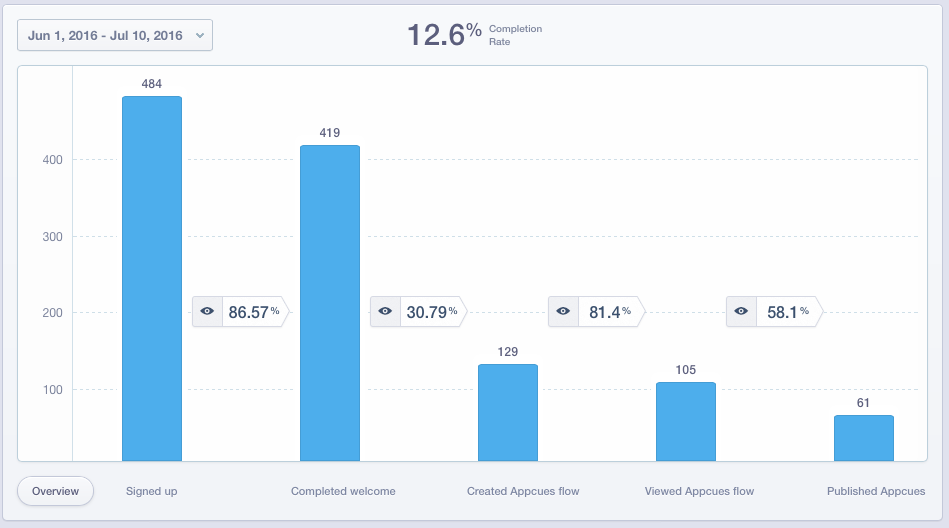
This is real data that we collected from one of our onboarding flows at Appcues. Since we saw the largest drop-off between steps 2 and 3, we decided to start investigating here.
Drop-off analysis is the core of funnel analysis - once you identify where users stall, you can design targeted interventions to get them back on track. Here's how we did it at Appcues.
To troubleshoot why our completion was much lower between the "completed welcome" and "created Appcues flow" steps, we took a close look at the value we were trying to provide users at those steps.
This is what our onboarding screens for steps 2 and 3 looked like:
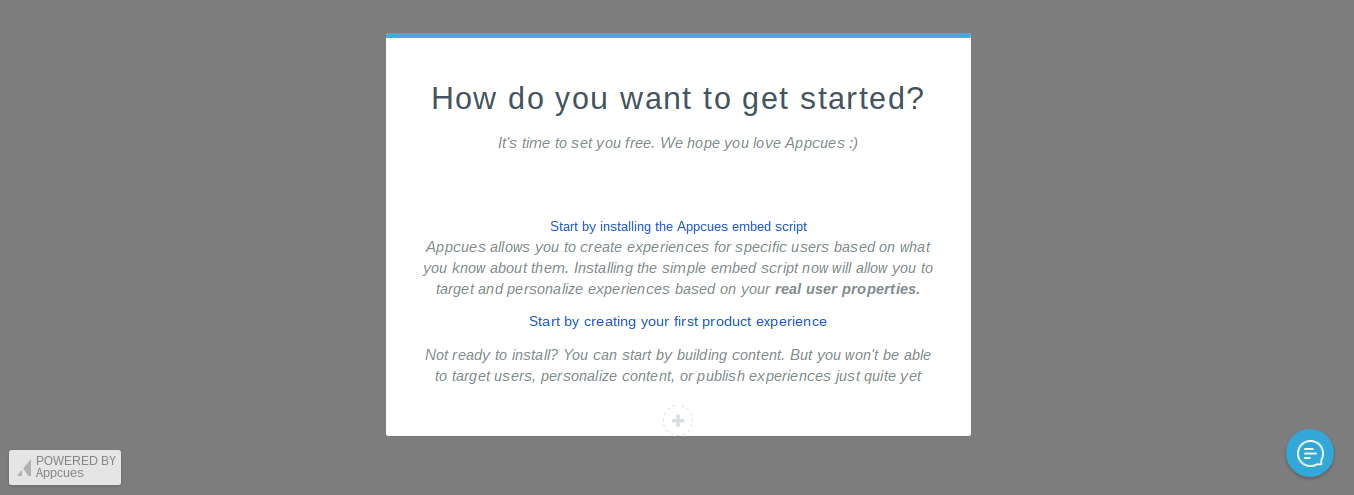
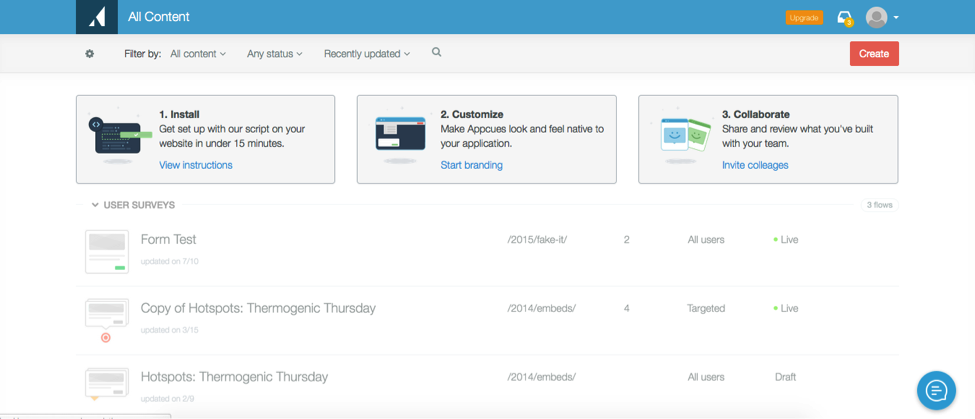
We had a hunch that step 2 gave one too many options, and neither option directly steered users to publishing their first Appcues flow. Users who chose to create their first flow still had to click a "create" button in step 3 to get started.
To fix this, we created a new in-app message with less text that redirected users straight to the design page:
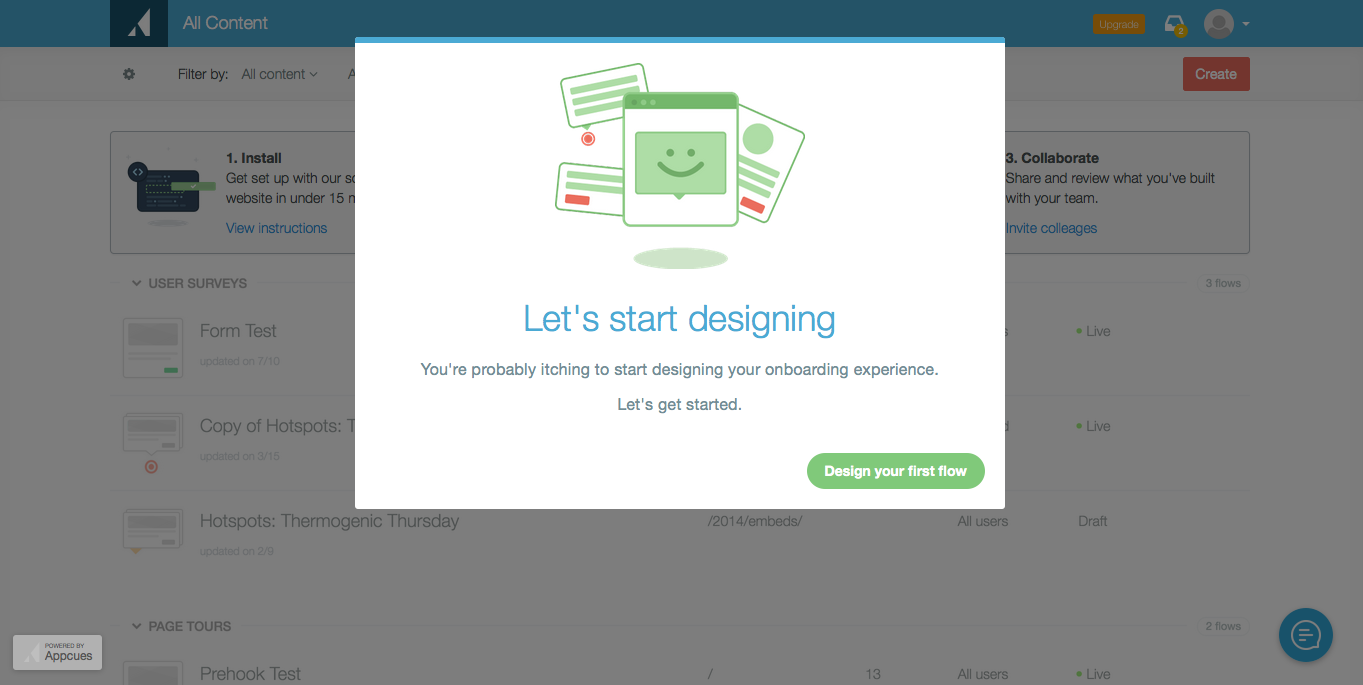
These became our new steps 2 and 3 respectively. While it was a quick fix using our own onboarding software, it did have an immediate impact on our completion rate:
There may not be an issue that applies to all users equally. In these cases, breaking down your data by cohorts can be tremendously helpful.
Here's what an onboarding funnel might look like for a music streaming service:

While the data suggests that there's an issue between steps 1 and 2, cohorts can provide more details as to why. Try segmenting by different user properties, and look for any differences in the conversion rate. In Mixpanel, you can filter results by the different properties you had previously set up right below your funnel.
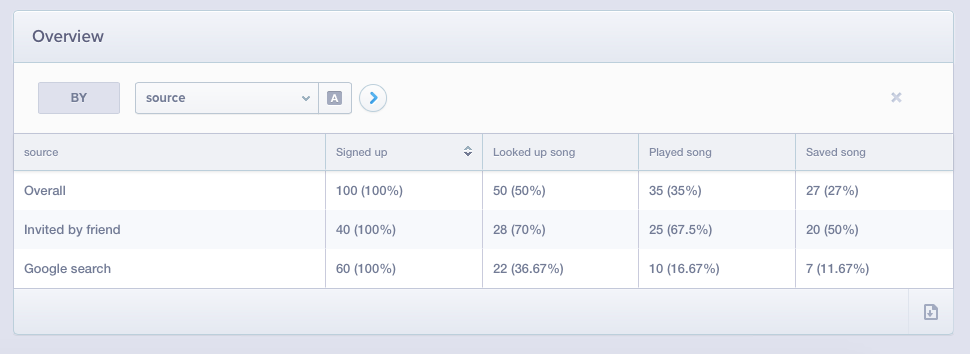
After segmenting by source, our fictitious music service found that the drop-off point for looking up a song was far higher for users who found the service through Google, compared to users who were invited by friends. This data might lead the music app to improve its user onboarding steps and double-down on its referral program.
The beauty of analytics is that it shows you behaviors you may not expect, so don't be afraid to play around with different cohorts and dig deeper into your user experience.
When choosing which cohorts to analyze, focus on the dimensions that most commonly reveal onboarding differences:
Building the funnel is step one. Knowing what to measure inside it is what turns raw data into decisions. Here are the five metrics that matter most when you're tracking onboarding performance in Mixpanel. (For a deeper dive, see our full guide to onboarding metrics and KPIs.)
In Mixpanel, you can track all of these directly in your funnel report. Use date comparisons to see how metrics shift after you make changes to your onboarding flow.
These resources will help you plan, build, and refine your Mixpanel onboarding funnel:
Funnels help you analyze the effectiveness of your onboarding experience against a meaningful task, but user onboarding never really ends. There are many opportunities to guide your users through more of your product's value and deepen engagement.
For help acting on your funnel insights, Appcues offers user onboarding software that makes it easy to build and iterate on personalized in-app experiences - without waiting on engineering. You can also explore our user onboarding guide for a deeper look at onboarding strategy.
Book a demo to see how Appcues and Mixpanel work together to turn funnel insights into better user experiences.


