.png)
Knowledge may be power, but do you know what’s even better than knowledge? Insight. It’s good to know things. It’s better to understand them.
When you know why something is the way it is, you have the information you need to make more effective decisions about how to manipulate and influence that thing. You can change outcomes.
Delivering insight is the whole purpose of product analytics. At a high level, product analytics helps you understand who your users are, what they are doing, what they need, and—most importantly—what you need to do to convert and retain them. The insights gleaned from product analytics empower you to deliver a better user experience that, in turn, helps you improve the KPIs that drive your business.
Getting set up to incorporate product analytics into your operations can seem a bit daunting, both from an implementation perspective and in terms of cost. However, according to a report from McKinsey, companies that take advantage of advanced product (or customer) analytics typically earn twice the profits of companies that do not employ these technologies. Seems worth the effort, if you ask us.
Companies in the market for the best analytics tool will quickly find that there’s no lack of choices out there, and many of the options seem to offer the same basic feature set. But, there are some nuances that can help you differentiate one from another.
In this post, we’ll go over some of the most popular product analytics and behavioral analytics tools so you can get a sense of your options.
Product analytics tools have 2 main functions: data tracking and data analysis. The first captures information about users and their actions. The second takes all that information and translates it into actionable insights delivered via visualizations, dashboards, and reports.
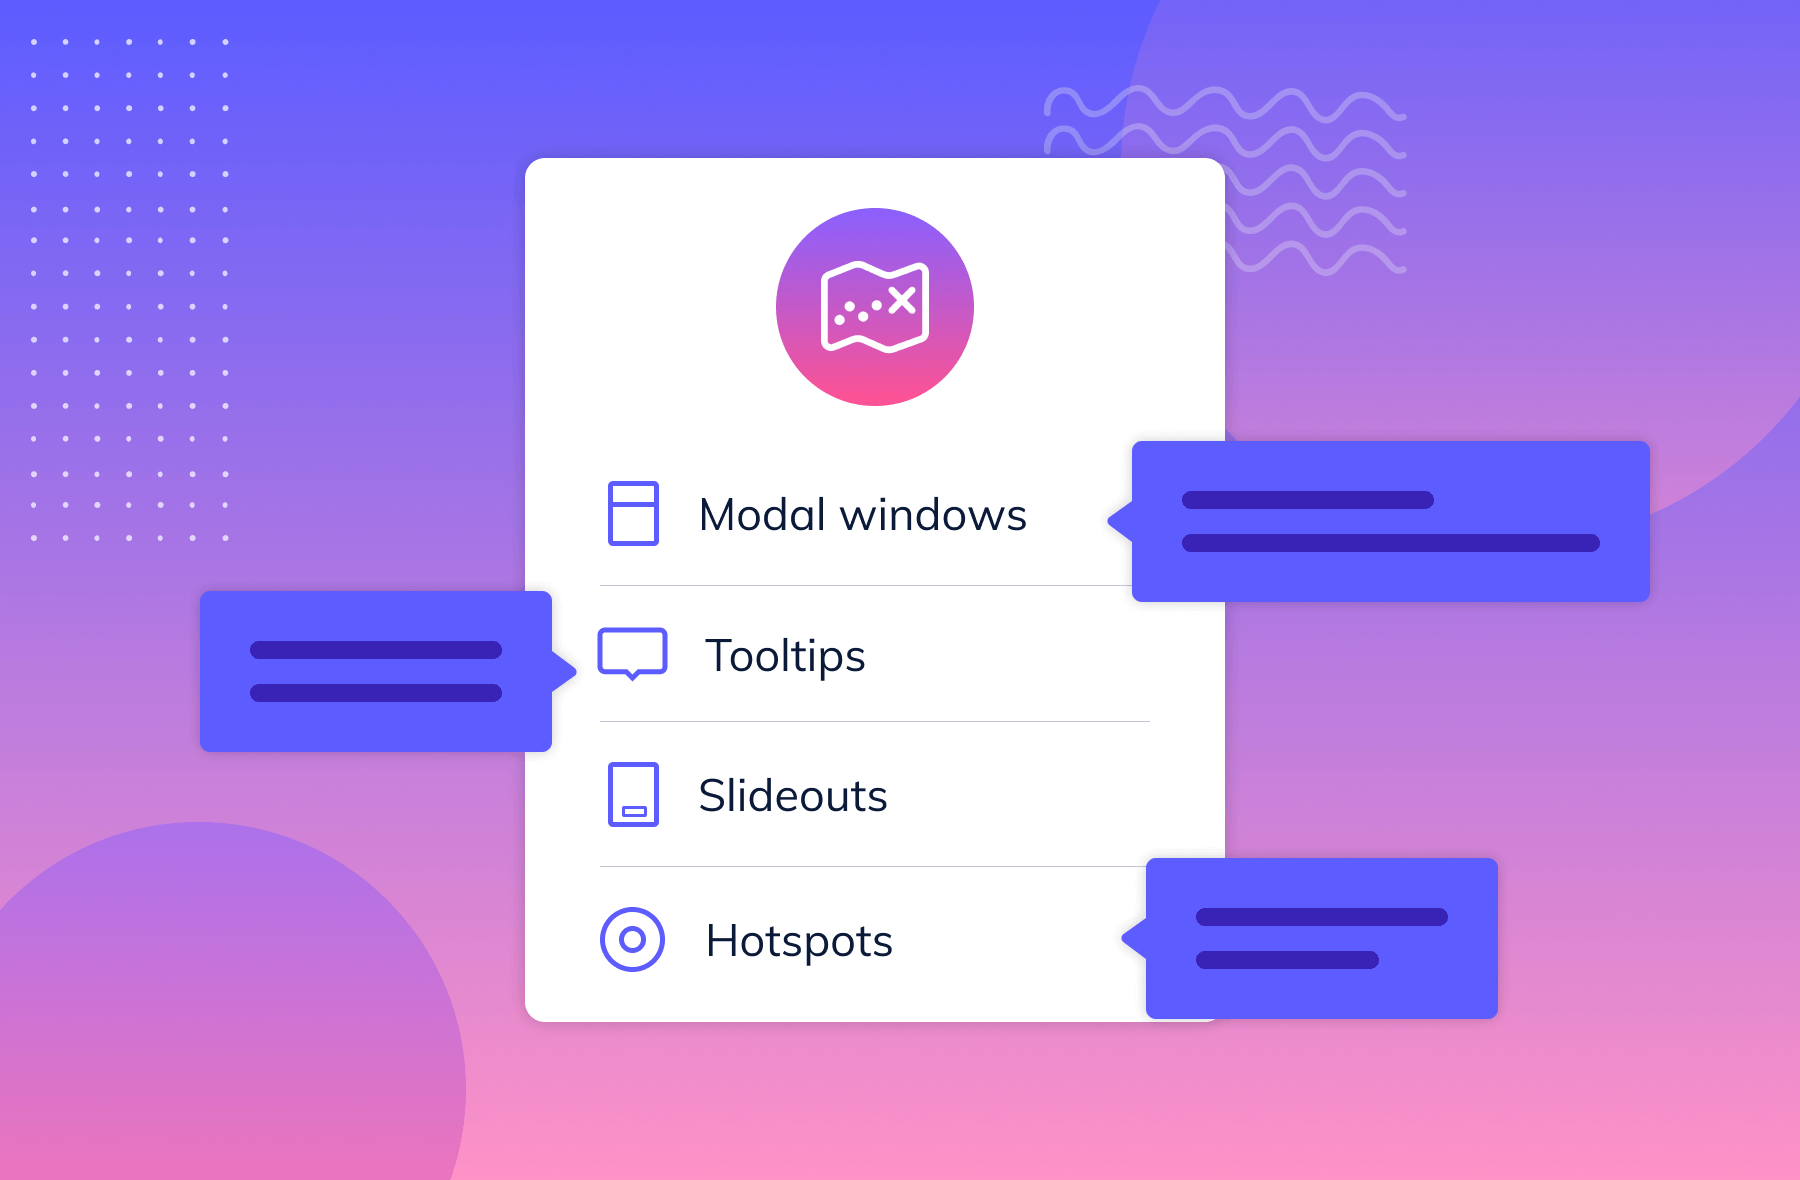
Product analytics software are used to track and collect a wide array of data from multiple sources. Analytics platforms help with user profiling and segmenting by capturing user data including details like location, device, age, entry points, referring links, and so forth. They also capture behavioral data by tracking user activity. Most product analytics solutions offer features such as session recordings, heat maps, on-page/in-app surveys, event tracking, and so forth.
All of this data is aggregated and then analyzed to provide detailed insights into how specific flows and funnels work (or don’t), usage trends, user profiles and paths, cohort analysis, conversion triggers, segment behavior, intent, and many other aspects of user engagement.
Ultimately, these data-driven insights help you answer questions that are critical to improving your product, your user experience, and your most essential KPIs. Analytics tools can help you answer questions like:
As you can imagine, the answers to these questions provide can be spectacularly valuable and can help you make better decisions about how to improve your product, successfully influence and guide your users, enhance your buyer and customer experiences, and generally know your customers more intimately so that you can serve them more effectively.
As we’ve already said, there are a lot of product analytics tools out there. Which one is right for you depends on exactly what you’re trying to accomplish, the investment you’re willing and able to make, how much technological complexity your team can manage, your reporting preferences, and so on.
It would take much more than a single blog post to cover all the available options in great detail, but even a high-level overview can be really helpful when you’re on the fence. To begin with, let’s look at 3 of the market leaders—companies that represent the “big players” in the product analytics space.
Each of these top-tier products offers a complete range of features and functionality. Most review sites rank these three quite closely in terms of overall functionality and user satisfaction.
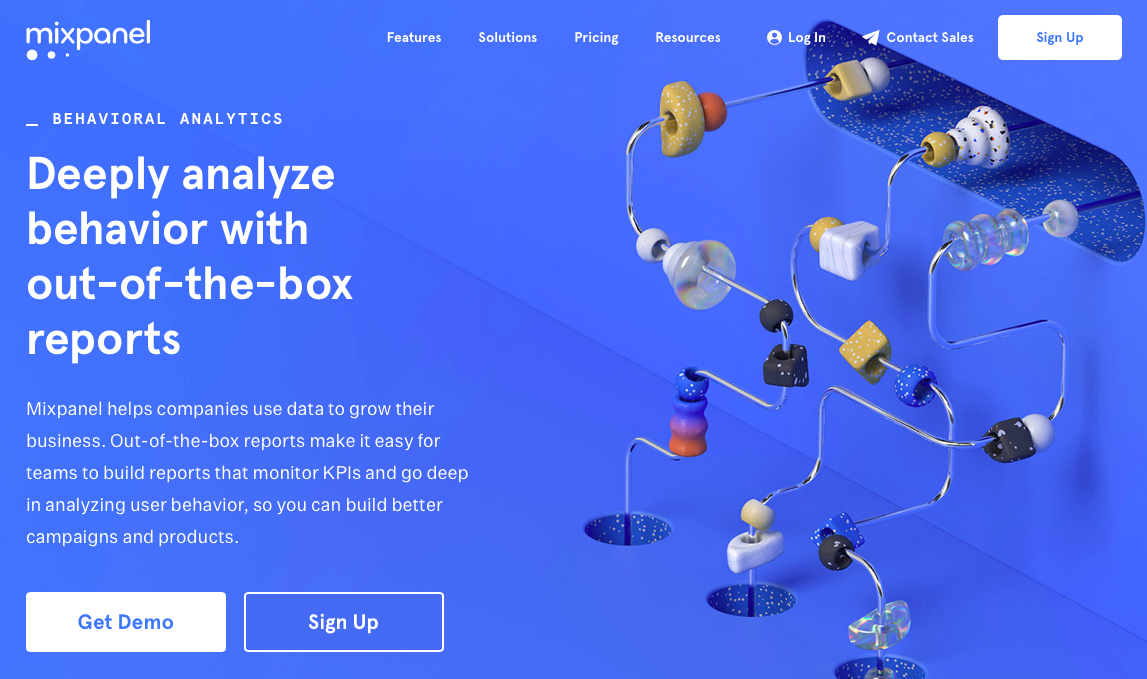
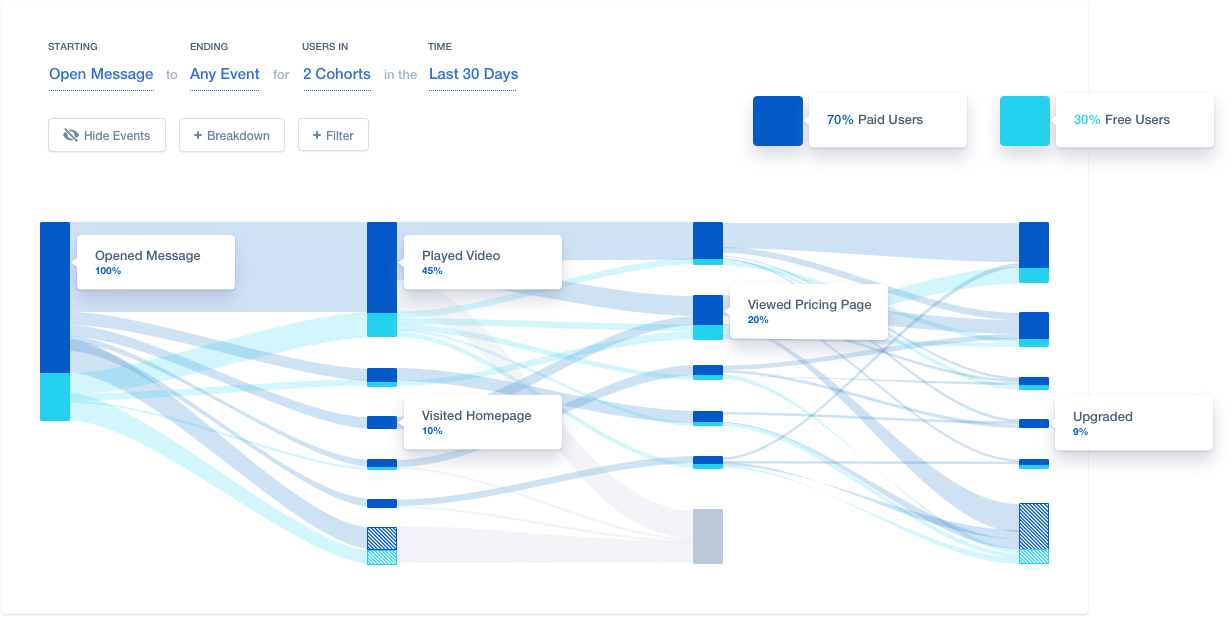
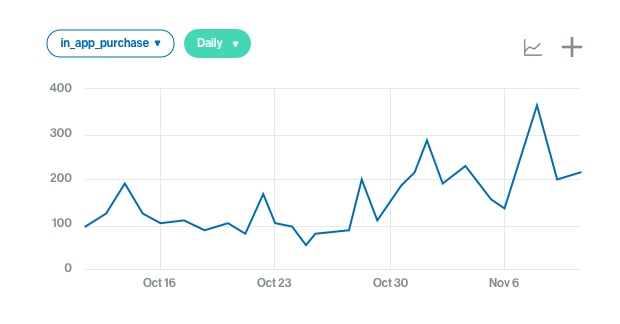
Mixpanel started life as a mobile app analytics platform, but has since evolved to be a very strong all-in-one player that integrates with other platforms, is able to send a variety of notifications (via email, SMS, push notifications, and in-app), and also includes a suite for marketing automation and CRM.
Like any event-based analytics platform, it requires that you define specific actions and events up front before you can collect and analyze your data. Mixpanel’s technical implementation difficulty level is on par with its closest competitor, Amplitude.
In addition to having unique notification features, Mixpanel also has a very robust SDK for their mobile analytics platform (including iOS and Android platforms).
They also have a more flexible and (often) less expensive pricing model than Amplitude. Mixpanel’s pricing tiers are based on a combination of event and user plans.
Another event-based solution, Amplitude also requires initial set up as a first step in accessing the benefits of their platform. Amplitude launched as a product analytics tool, and that is still their primary focus. Unlike Mixpanel, they aren’t interested in being everything to everyone.
While their free plan is generous in terms of volume (10 million actions per month), it does not include many of their unique features such as Compass (a feature designed to help identify behaviors that are predictive of retention or conversion) or their SQL integration. Those are only available with a subscription.
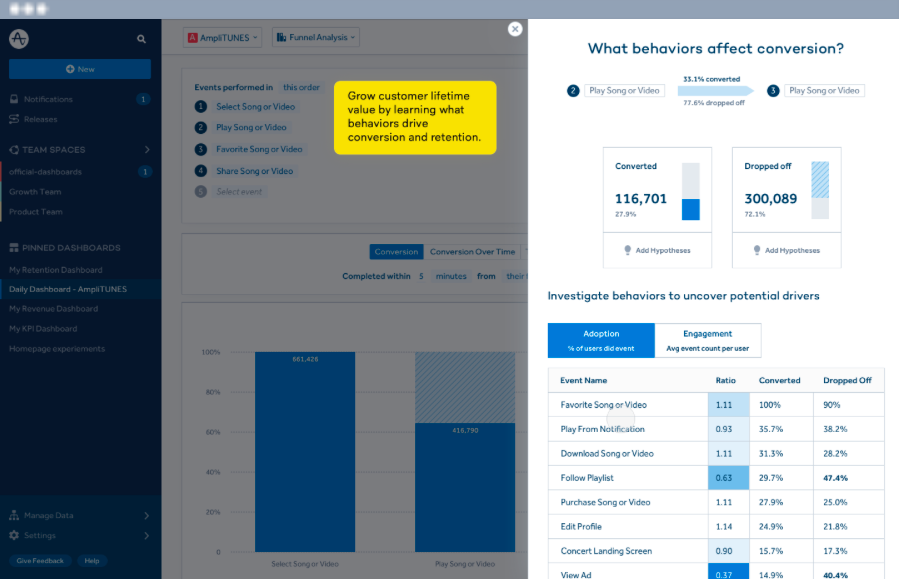
Amplitude’s strength is in its focus on uncovering the aha moments that represent key milestones in the user journey. Their product is an excellent tool for digging deep on feature adoption, real-time performance, funnels, and user behavior. While both Amplitude and Mixpanel offer many of the same reports, there are a few—Personas, Lifecycle, and Impact—that are only available from Amplitude.
Like Mixpanel, Amplitude offers 3 pricing tiers:
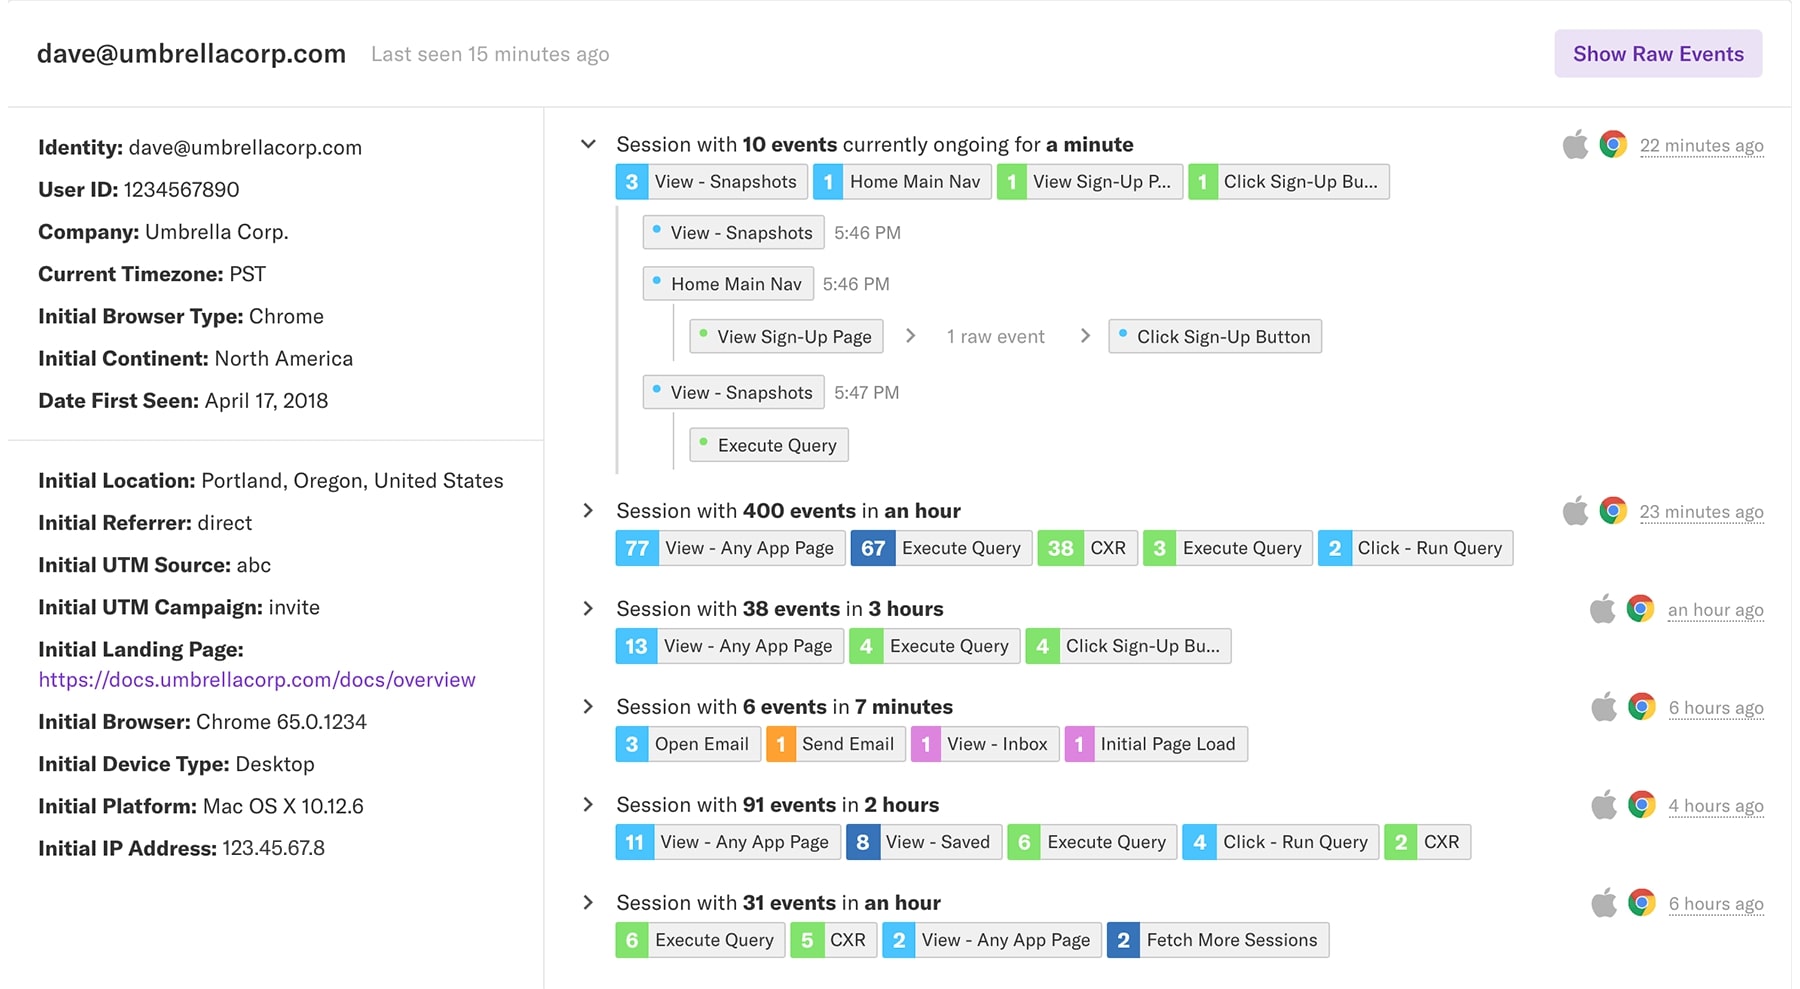
Unlike Mixpanel and Amplitude, Heap doesn’t require you to set up specific actions and events. Instead, they take a unique approach by automatically capturing data without needing any upfront configuration. Their focus is on agility and giving users the ability to iterate quickly.
To this end, they provide a more flexible data model than their top competitors. Using Heap, users (even non-technical ones) have the ability to create virtual events that they can then use in funnels, cohorts and other types of analysis. These virtual events can be modified or replaced at any time with minimal effort.
Like Amplitude, Heap’s free plan is somewhat limited, but they do offer 2 other pricing tiers with more complete functionality:
Mixpanel, Amplitude, and Heap may be the front runners on most comparison lists, but there are plenty of other options out there—some that have been around for a while, others that are new on the scene. Here’s a quick overview of some of the more popular and promising in the field.
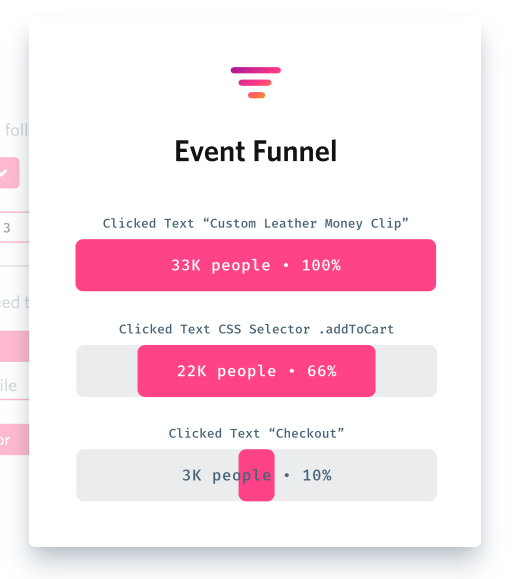
FullStory is on a mission to help their customers create better digital experiences through experience analytics. Features include on-the-fly conversion funnels, advanced search capabilities, video-like replay of real user sessions, and robust debugging and developer tools. They do not require event instrumentation. FullStory also offers strong data analysis, robust collaboration tools so you can share your insights, and a wide range of integrations.
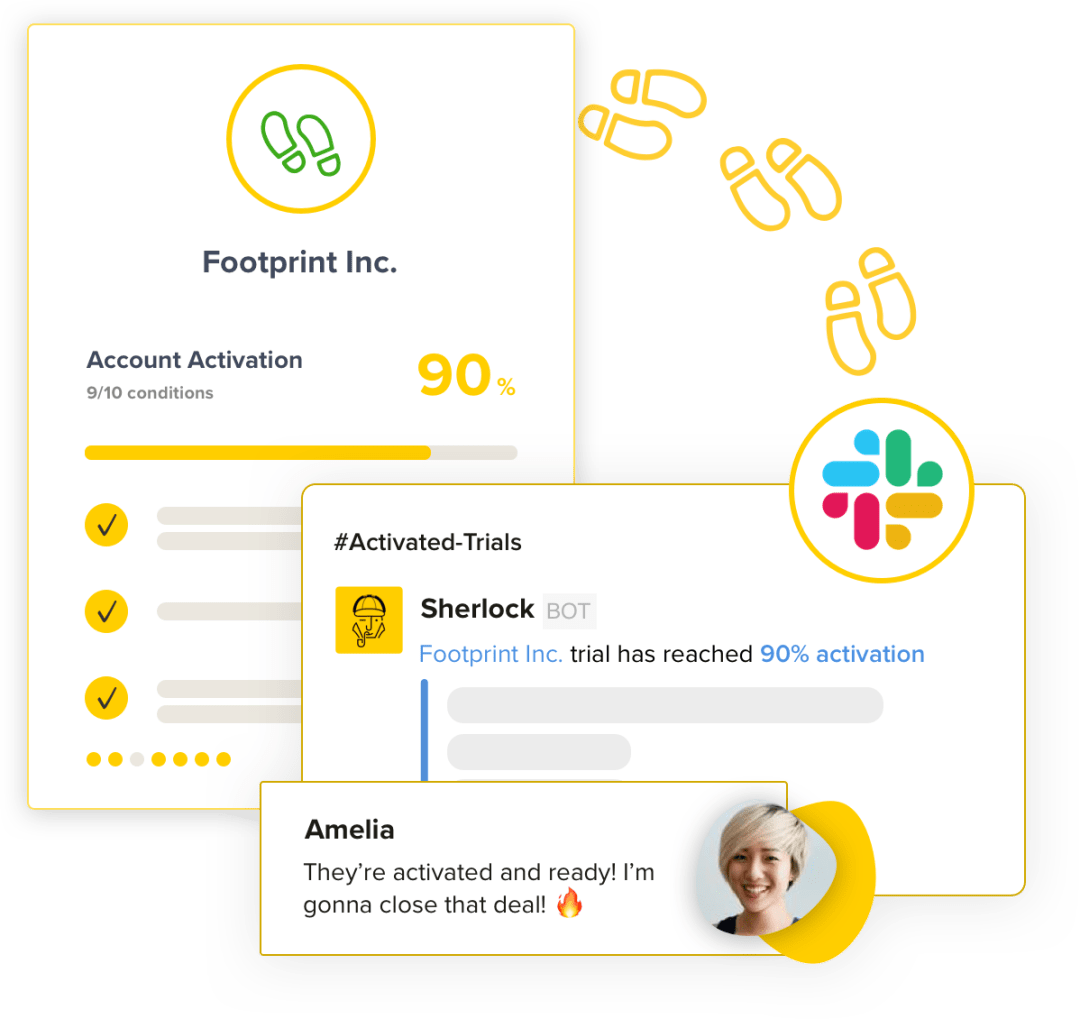
Sherlock is a product engagement scoring platform that translates all in-app actions into a definitive ranking of your most (and least) engaged users. If you have instances of multiple users on a single account, it also provides scores at the account level. Their goal is to help you identify how engagement is trending, which features drive the most engagement, and other key insights that help you prioritize sales, marketing, and product efforts.
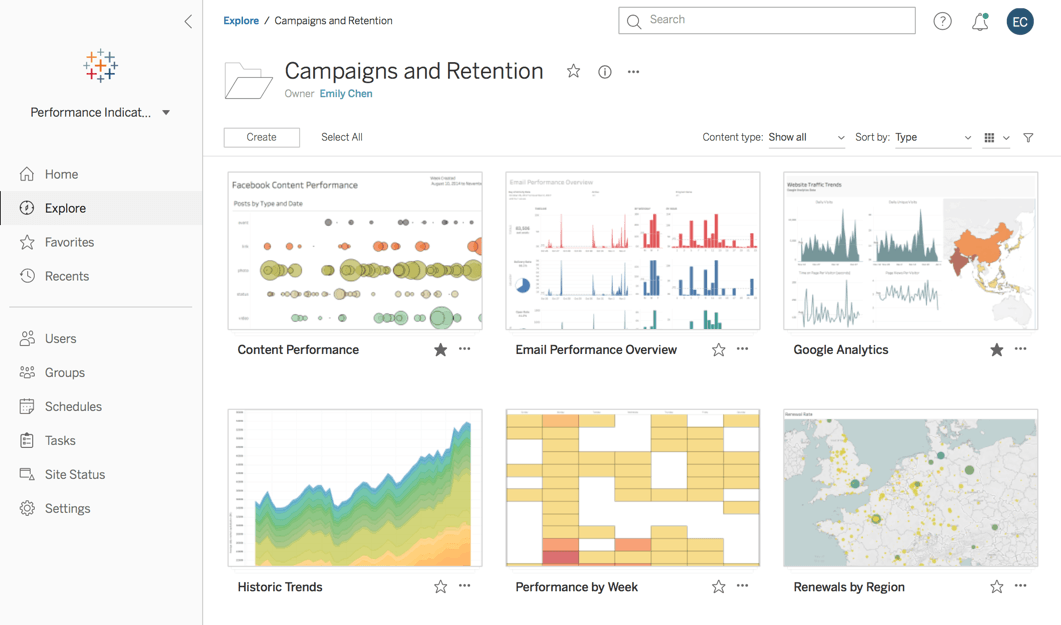
Committed to providing a revolutionary new approach to business intelligence, Tableau focuses on making databases and spreadsheets accessible to ordinary people in order to unleash the power of your data and the potential of your people. Their platform allows you to quickly connect, visualize, and share data in a seamless cross-device experience that requires no programming skills.
Tableau offers to deployment options—Tableau Server (on-premise or public cloud) and Tableau Online (fully hosted by Tableau). Pricing varies (and additional add-ons may apply).
License options include:
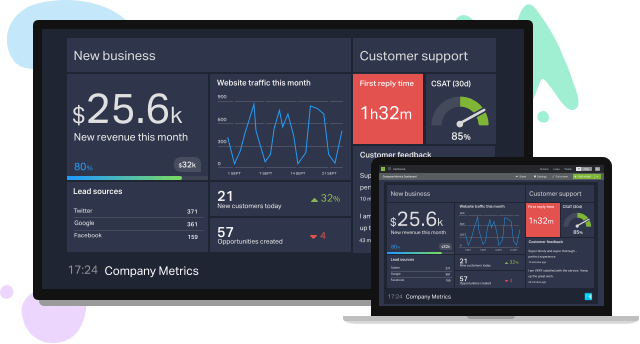
Keep your metrics top-of-mind for everyone on the team with customized TV dashboards that are easy to create and manage. Geckoboard allows you to pull in metrics from 60+ code-free integrations, or freestyle with spreadsheets and their datasets API. Choose the metrics you want to show, and fine tune them using visualizations and filters and their intuitive drag-and-drop assembly tool. The result is secure, powerful, real-time access to clear dashboards that anyone can understand at a glance.
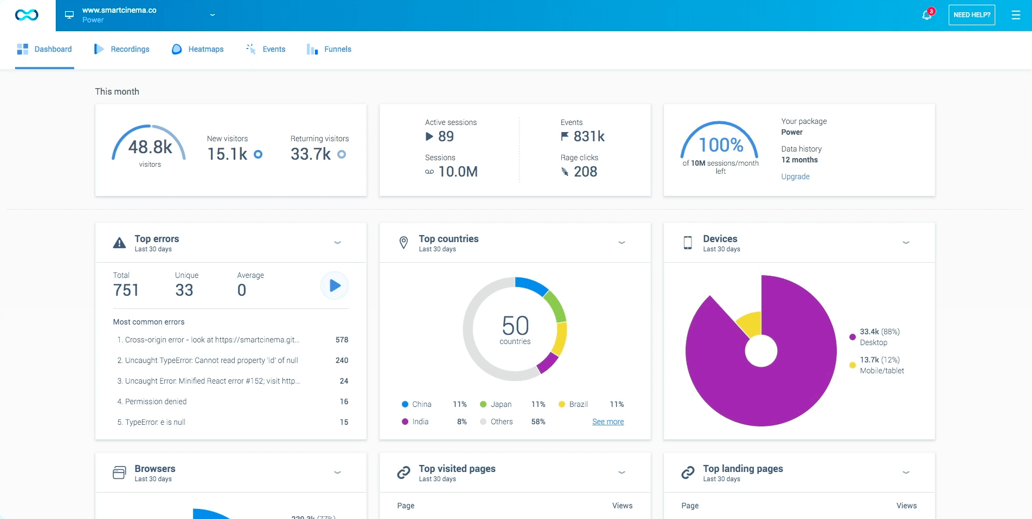
Smartlook’s qualitative analytics solution for web and mobile (iOS, Android, Unity, and Metal) helps you understand user behavior at the micro level with always-on visitor recordings, heatmaps, automatic event tracking, event statistics, and funnels connected to recordings.
Smartlook offers 2 sets of pricing for websites and native mobile apps. Each set has 3 tiers. Prices vary depending on session volume and data history needs.
Websites
Native apps
Custom pricing packages also available
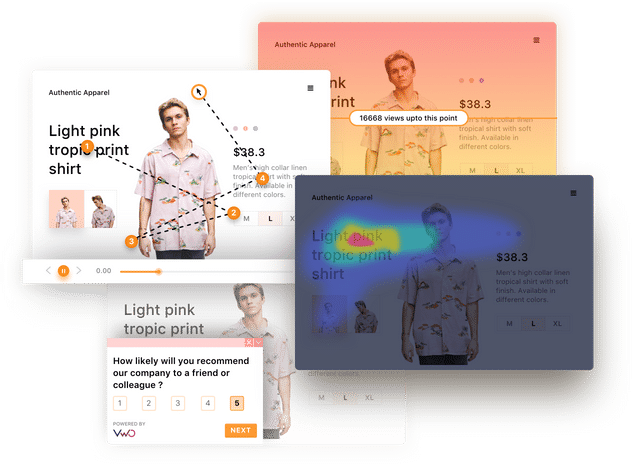
In addition to providing product analytics features, VWO also offers a wide variety of testing capabilities including A/B, multivariate, split URL, server side, and mobile app testing. They offer a way to embrace multi-channel experimentation that goes beyond emails to leverage automated marketing campaigns that use web push notifications, Facebook Messenger, and other channels.
VWO pricing (as of December 2019)::
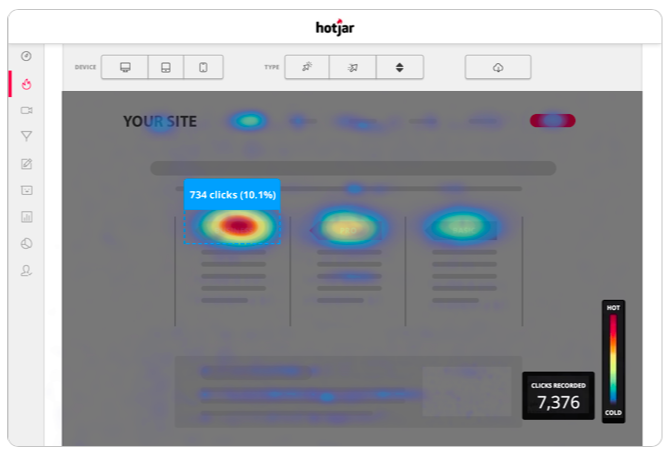
Using heatmaps, session recordings, and surveys, Hotjar helps you uncover the “why” behind page traffic and drop-off rates. It complements traditional web analytics tools like Google Analytics, offering a user-friendly way to gain a better understanding of your user behavior.
Personal plans
Business plans
Agency plans
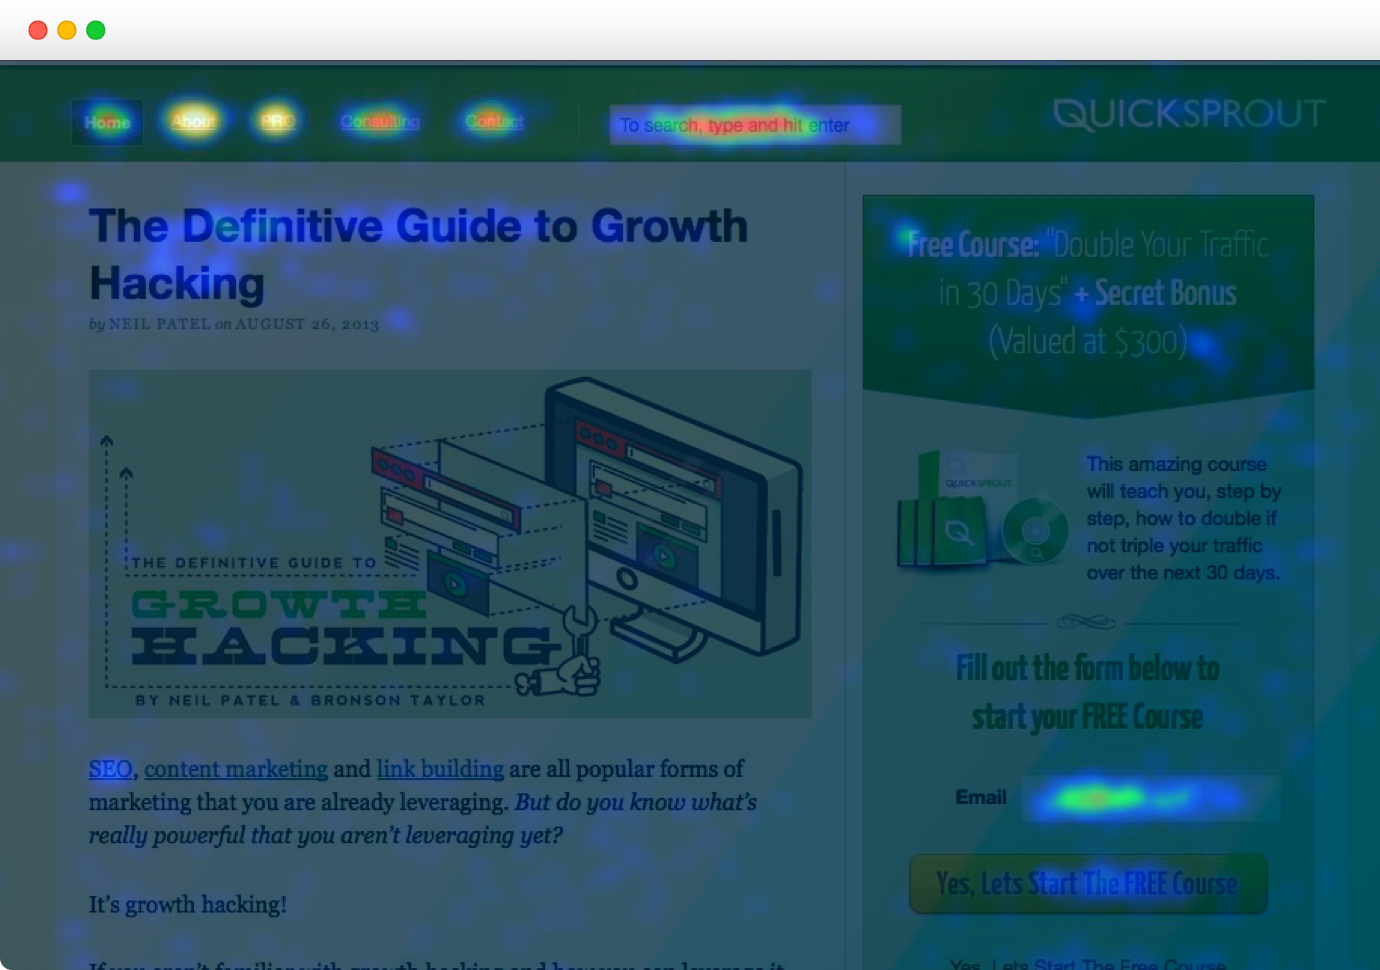
One of the original analytics solutions, Crazy Egg lets you visualize your website’s visitors through snapshots, heatmaps, and recordings. Their platform requires no hardware, almost no IT involvement, and no long-term commitments. They also offer A/B testing to test content placement, color, image, copy, etc., and their Crazy Egg Editor allows you to modify content without the need for developer support.
Request a demo
Focused on mobile consumer behavior, this Yahoo company offers analytics for both iOS and Android apps—for free. Flurry helps you easily track key usage metrics (new users, active users, sessions, and more), and also offers additional insights through dashboards, retention metrics, instant analyses of specific user groups and actions, crash analytics and reporting, in-app revenue analytics, app audience metrics, event tracking, user segmentation, push notifications and messaging, and more.
Free
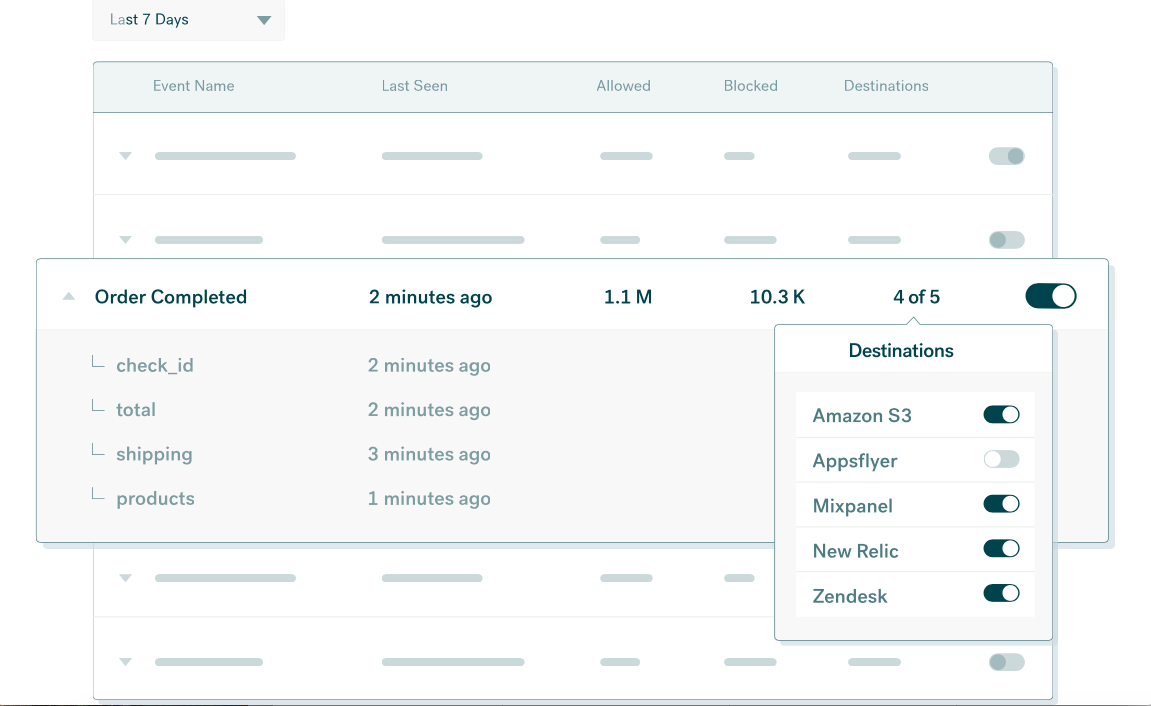
Segment allows you to collect, unify, standardize, and activate your first-party customer data in more than 200 marketing, analytics, and data warehouse tools, all with a single API. This foundational tool allows you to integrate first-party data across your entire marketing and analytics stack, prevent bad data by enforcing common standards, and achieve better visibility into data (while ensuring it meets privacy standards). From connection to data governance to audience management, Segment helps companies unify user history across different channels, identify preferences, and personalize experiences.
With all the available tools, there’s really no excuse to put off getting to know your users better. No matter which of these product analytics solutions you choose, you will gain valuable insights into who your users are and what they want from you. You will be able to build a better product, create a better user experience, and—in the process—improve the KPIs that propel your business forward and set it up for long-term success.
The data is out there. You just need to make good use of it.